We passionately believe that everyone should have equal access to high-quality Bitcoin data.
Unlike many other sites, we provide all Bitcoin charts for free with full on-chain history, plus key information so you understand how they actually work.
Want to get an extra edge on your Bitcoin investing? Sign up HERE to get Instant Alerts for charts, newsletters, and real-time chart tools for a fraction of the standard industry price.
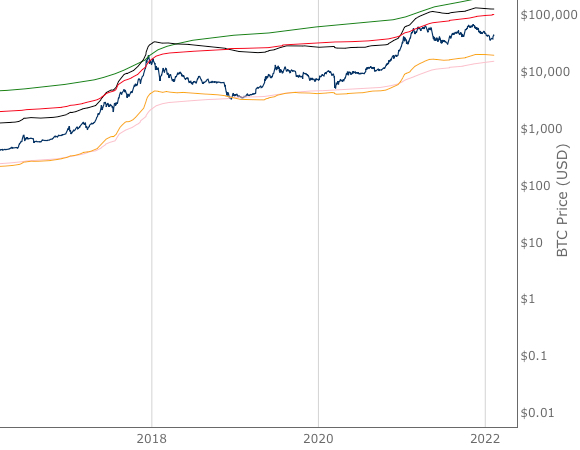
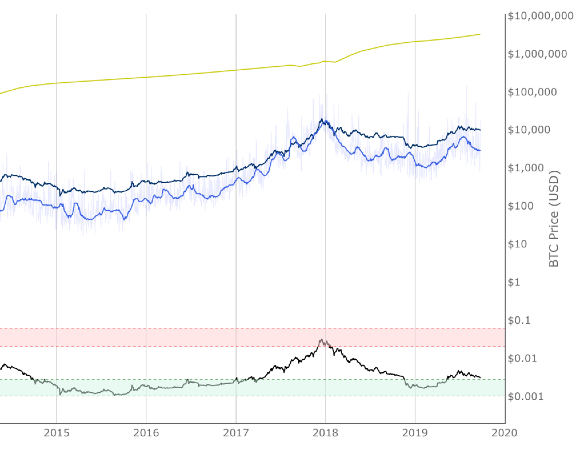
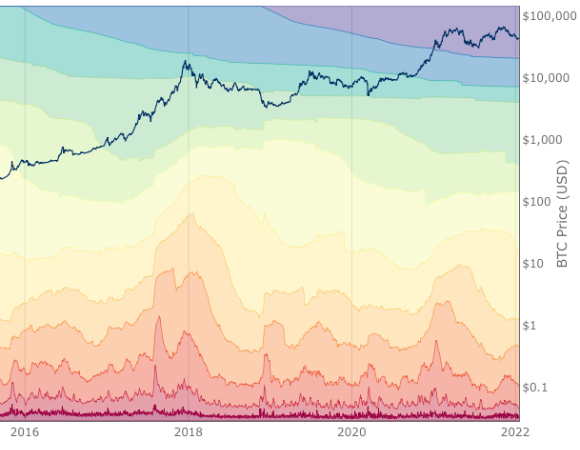
Top Cap, Terminal Price, Delta Top, CVDD, Balanced Price
View of the percentage of coins HODL'd on the blockchain for over 1 year.
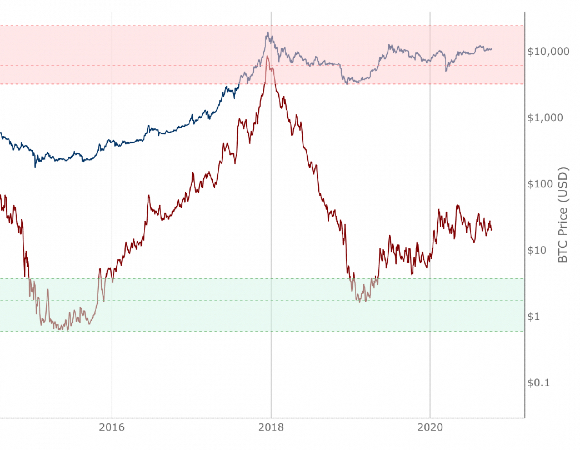
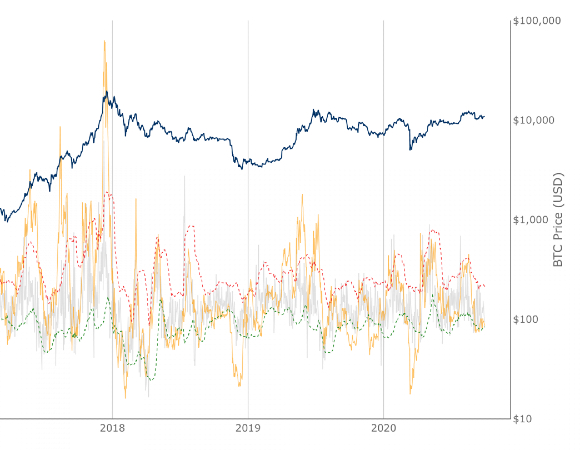
Pulls apart differences between Market Value and Realised Value to identify market cycle highs and lows.
On Chain Indicator using Realized HODL Ratio’s to identify cycle high price tops.
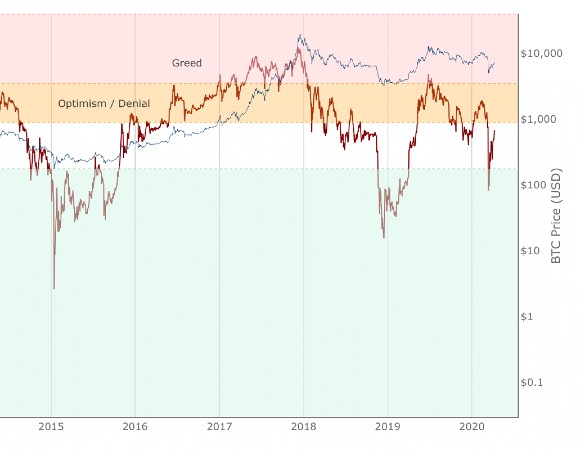
On-chain indicator for investor sentiment market stages
Long term Bitcoin investor confidence relative to Bitcoin price.
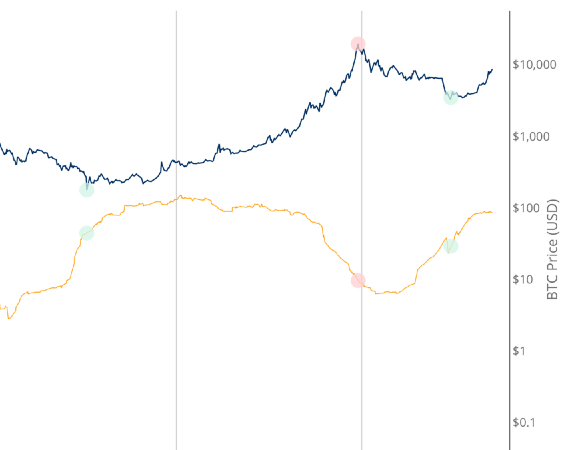
Comparing change in price with change in number of addresses to determine if Bitcoin is over/undervalued in the short term.
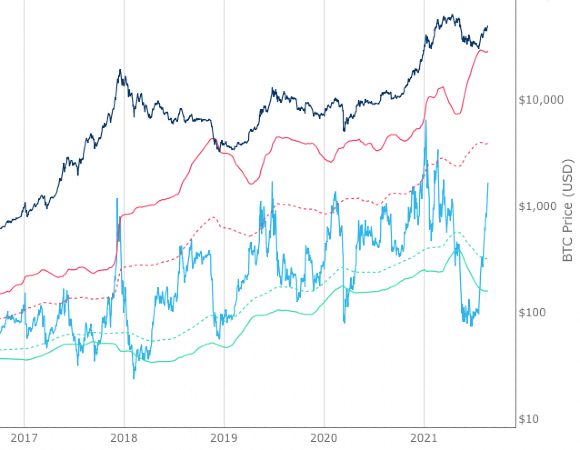
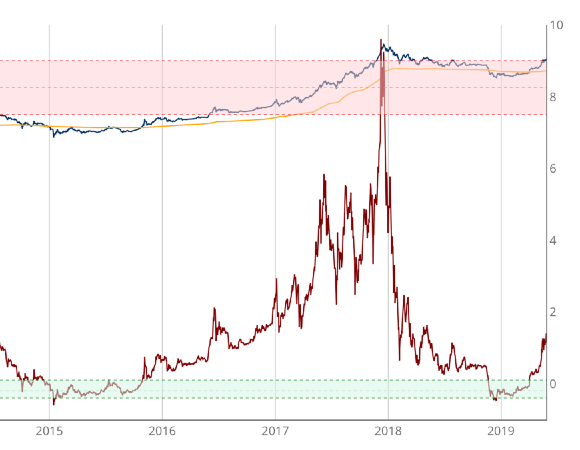
This adaptation of NVT Signal adds standard deviation bands to identify when Bitcoin is overbought or oversold.
Percentage of bitcoins that have last moved on-chain within specific time frames.
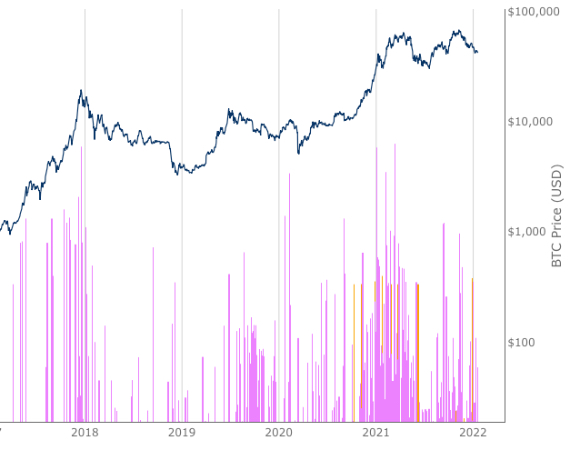
Onchain tracking of old coins moving again in large amounts.
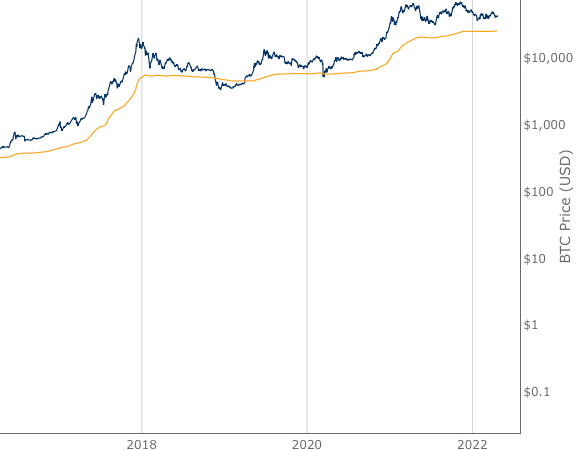
The aggregate cost-basis of all bitcoin.
Please note, the indicators above are experimental. There is no guarantee certain rules within each model will continue to apply as Bitcoin progresses along its adoption journey. Any information on this site is not to be considered financial advice. Please review the Disclaimer section for more information. Please review the Disclaimer section for more information.