
Source: lookintobitcoin.com
Zoom in with touchscreen: Touch and hold with ONE finger then drag.
Zoom in on desktop: Left click and drag.
Reset: Double click.
Dominate trends across Bitcoin, altcoins, stocks Color-coded: green = bullish, red = bearish Easy-to-use and highly effective
Exclusive Offer! Get 10% OFF using this link and code: LIB10
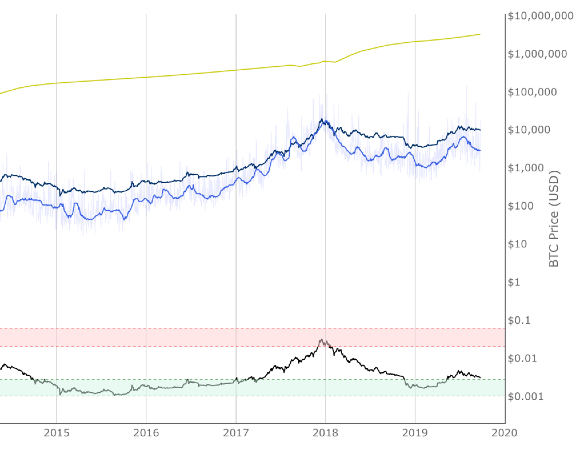
This is an evolution on a previous on-chain indicator called NVT Signal.
NVT Signal takes the total value of the Bitcoin network (which is another way of saying its market cap) and divides it by the 90 day moving average of daily transaction value.
NVT Signal = Network Value / 90DMA of Daily Transaction Value
NVT Signal was originally used as a way of picking cycle tops, but due to more coins being held off chain over time, the efficacy of NVT Signal has declined.
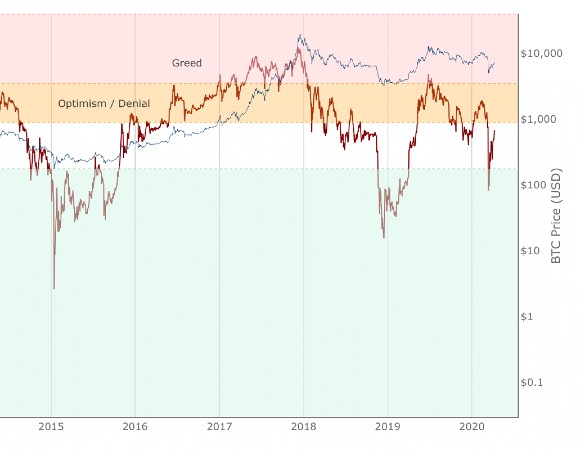
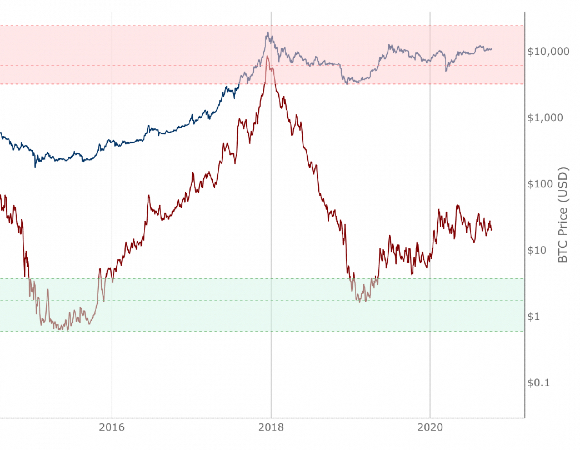
This adaptation of NVT Signal adds standard deviation bands to identify when Bitcoin is overbought (red zone) or oversold (green zone). This can provide intra-cycle take profit points for Bitcoin investors.
Advanced NVT Signal uses investor activity (volume) on the Bitcoin blockchain to predict whether Bitcoin price will go up or down at key levels when the indicator is reaching extremes in the data points. It can be used to try and forecast Bitcoin price on medium time frames as the indicator moves between the upper red and lower green boundaries.
Another live chart that is more focused on lower timeframe moves is the Active Address Sentiment Indicator.
On-chain indicator for investor sentiment market stages
Long term Bitcoin investor confidence relative to Bitcoin price.
On Chain Indicator using Realized HODL Ratio’s to identify cycle high price tops.
Any information on this site is not to be considered as financial advice. Please review the Disclaimer section for more information.